Histopathological Biomarker Extraction by Computer Vision
Introduction
There are many approaches to applying the computer vision (CV) models in pathology. One common approach is to train a model to give a “black box” prediction of a clinicopathological characteristic of interest. For example, we use a CV model to predict progression-free survival of patients with breast carcinoma. There is a downside to this approach. When we do post hoc analyses, it becomes sometimes hard to investigate the model interpretability. The attributions of some “weird” visual features are higher than human-interpretable features (HIFs). For example, the model can rely on “spaces around the cell nuclei”, which can be an artifact rather than a real feature, more than “chromatin structure”, which is a HIF. It is sometimes very challenging to explain these weird behaviors.
Instead of making the model hard to understand, we can take the opposite approach. We can use CV models to predict the already-known HIF and then perform post hoc analyses on their calculated results of HIF. By this way, we can easily control the interpretability part of the model. Actually, the quantitative extraction of histopathological features is one of the most trending approaches in digital pathology research. As we all know, histopathological whole slide images (WSIs) are very rich in such HIF features. HIFs can be well-known or novel features, as long as they can be interpreted by human pathologists.
In this mini-review, I will summarize the landscape of this approach in the field of digital pathology.
Mitotic Count
Mitosis is a good example to start with. Mitosis (mitotic figure) is a morphological feature representing the mitotic spindle of biological mitosis. Biological mitosis is a type of cell division in which one cell divides itself into two daughters. What we see in the mitotic figures in histopathology is the phenomenon of chromosomal separation in different mitotic phases, which relates to different shapes of these figures. The more mitotic figures counted, the higher the capacity of cancer cells to proliferate.
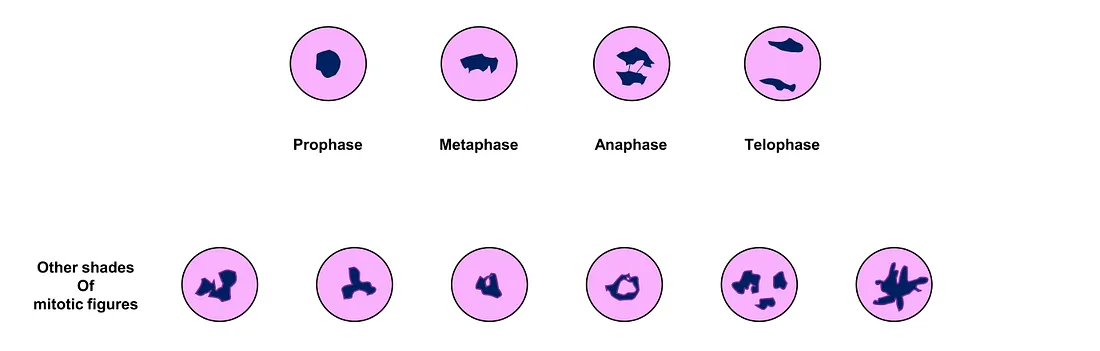 Different shades of mitotic figures (created by author)
In practice, pathologists usually count the density of mitotic figures per microscopic field (pathologist-friendly) or mm2 (which is more accurate but more difficult), depending on the criteria. The feasible way for pathologists to do this is to subjectively pick up the most representative microscopic fields to perform the task, which will naturally lead to the problem of subjectivity.
Using CV models can address this issue. Object detection of CV models is an obvious solution to the mitotic detection/count. Mini-patch classification is also an approach that can solve the mitotic count/detection problem. Another (interesting) approach is to leverage image captioning and visual question-answering tasks in formulating mitosis detection [1].
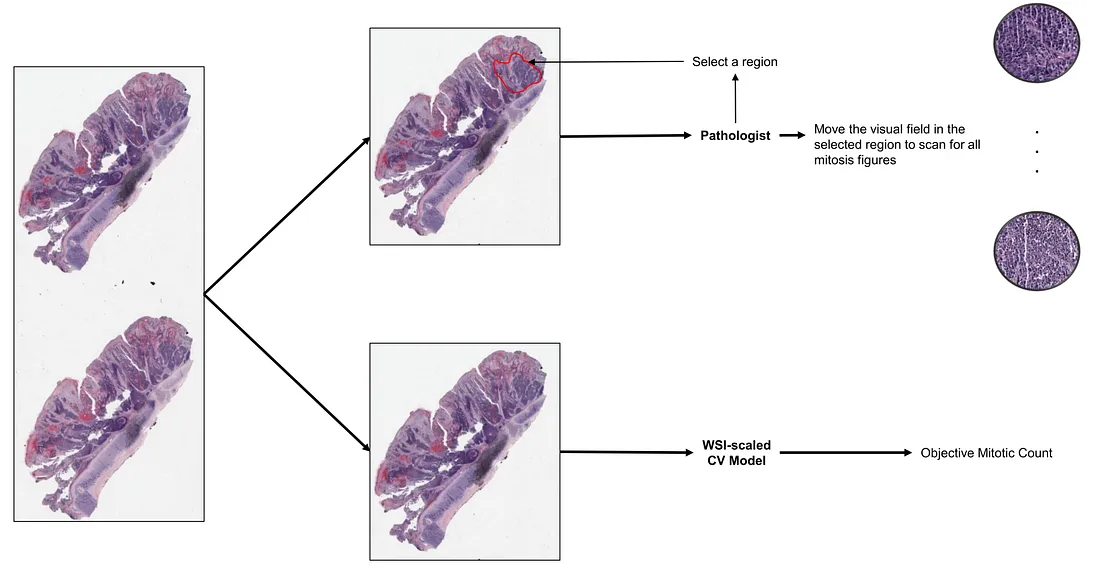 How pathologists and CV models count mitosis (created by the author)
Tumor-Infiltrating Lymphocytes (TIL)
TIL is one of the actively investigated biomarkers in histopathology. In cancer biology, tumor microenvironment (TME) is shown to be involved in many processes of cancer progression. In its evolution, cancer cells gain the ability to modify the TME and make their own favorable environment. This environment is called pro-tumor TME, making these malignant cells comfortable to grow and invade into the adjacent tissue. In another scenario, the tumor cells are unable to orchestrate their favorable environment, making them hostage to the host (patient). The immune system of the patient will deploy its immune cells, including lymphocytes and macrophages, into the TME. Therefore, one of the histopathological signs of different TME is TIL. TIL indicates genetically normal lymphocyte that permeates into the TME. Whether TIL is pro-tumoral or anti-tumoral activated depends on the context and cancer type. However, TIL-rich TME is a tale told of a very immunologically “busy” or “hot” environment surrounding the tumor cells.
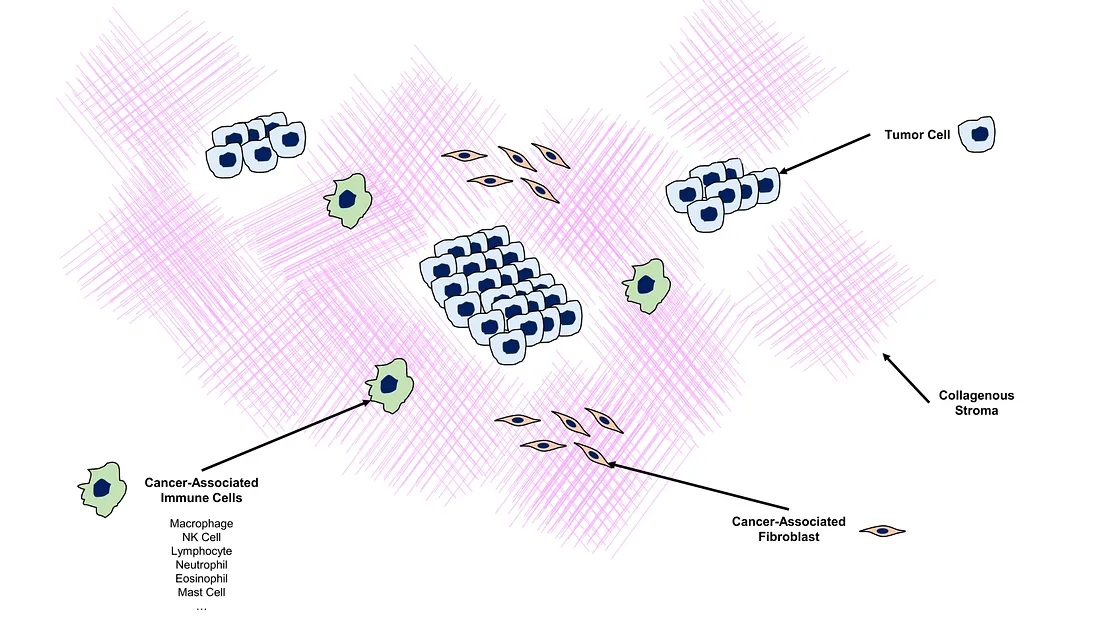 Illustration of Tumor-Microenvironment (created by the author)
The main idea of the TIL metric is the percentage of TIL within the entire tumor-related stroma (collagenous and TIL).
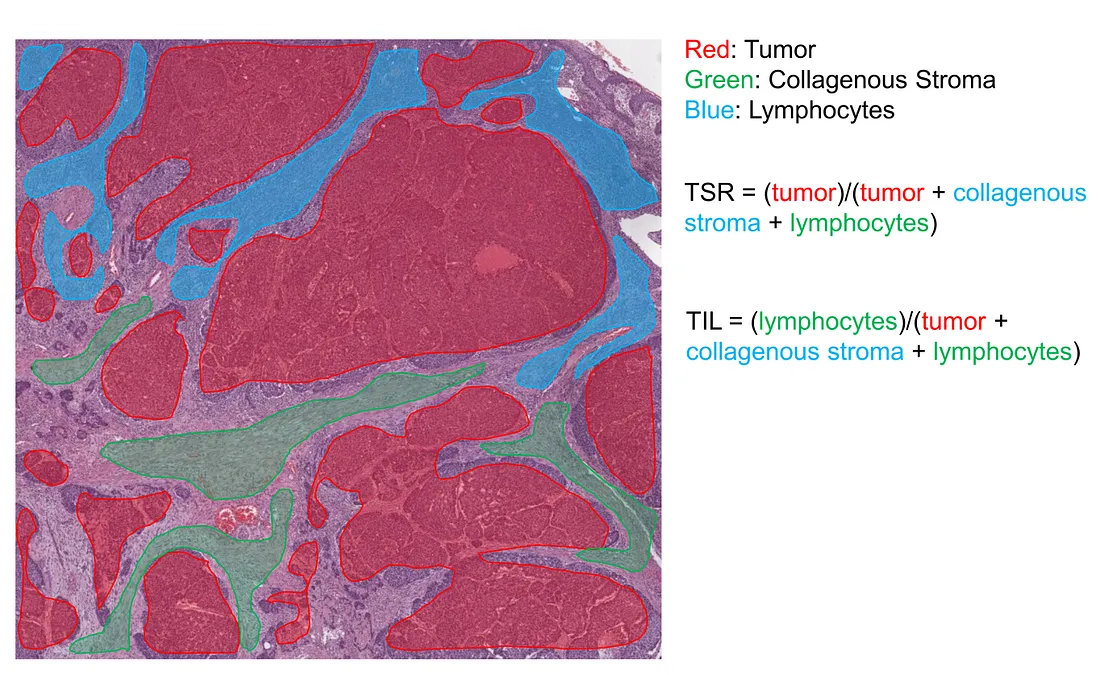 Illustration of how semantic model calculates TSR and TIL (created by the author)
The pathology practice guideline of TIL assessment in breast cancer can be found in the literature [2]. The general conclusion for this guideline is that it is solely based on the “pathologist’s perception” of how much TILs occupy the area of tumor-related stroma. This obviously leads to the issue of subjectivity, not to mention there is a long list of rules to follow.
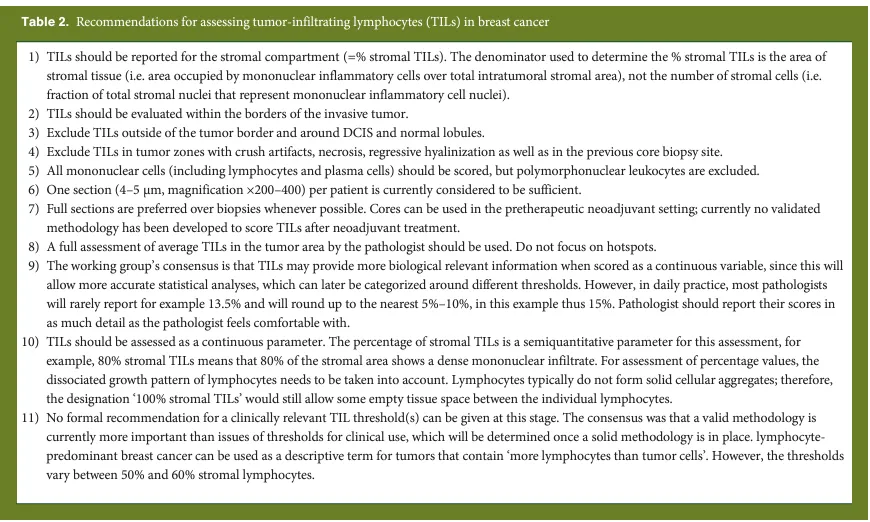 A long list of rules/recommendations to evaluate TIL by a pathologist. This table is from [2]
When CV models come into the story, it is clear that these models, if trained properly, can alleviate the subjectivity problem. The most straightforward solution for this task is semantic segmentation, where tumor cells, collagenous stroma, and TILs are must-have classes.
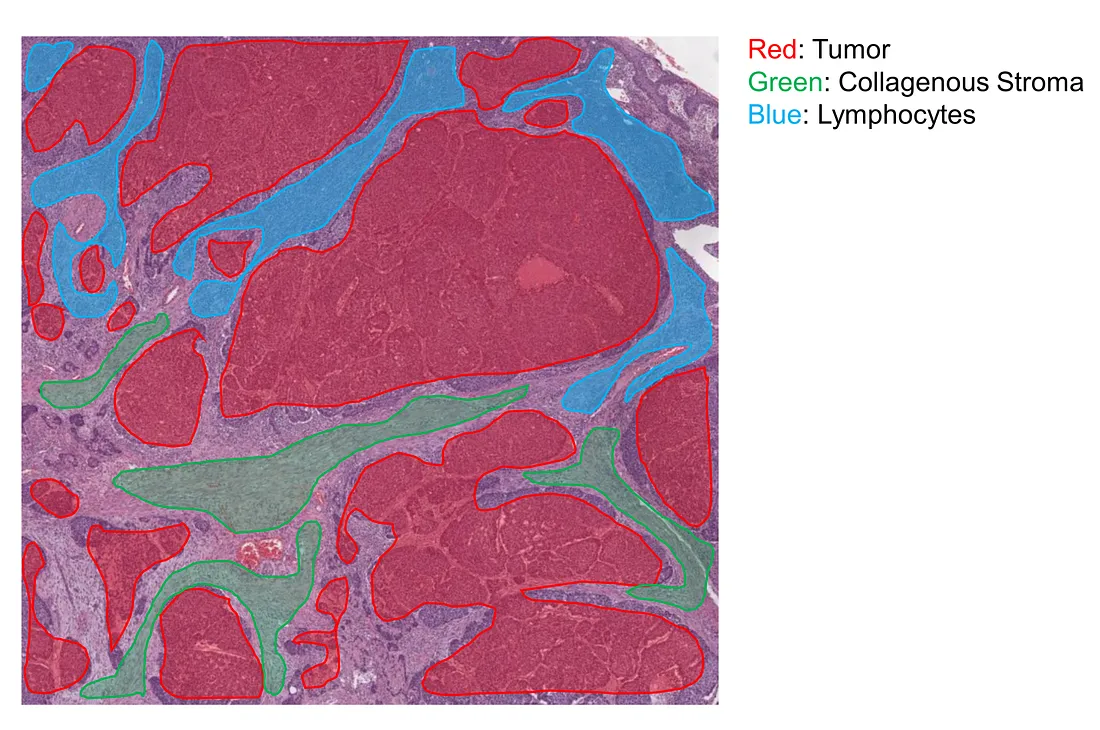 An example of classes for semantic segmentation (created by the author)
Tumor-Stroma Ratio (TSR)
In the TME, the overall structure of stroma, including collagenous and inflammatory stroma, is also an important feature besides TIL. Biologically, the stroma is a complex and dynamic microenvironment surrounding tumor cells, without considering other cell types within it. However, pathologists consider non-cancerous cells to be also a part of stroma. Therefore, this microenvironment is composed of connective tissues, blood vessels, immune cells, fibroblasts, and signaling molecules. Such signaling substances directly or indirectly affect the tumor behavior as well as the relation between non-cancerous cells and tumor cells. This can be a factor facilitating tumor growth, metastasis, drug resistance, and immune evasion.
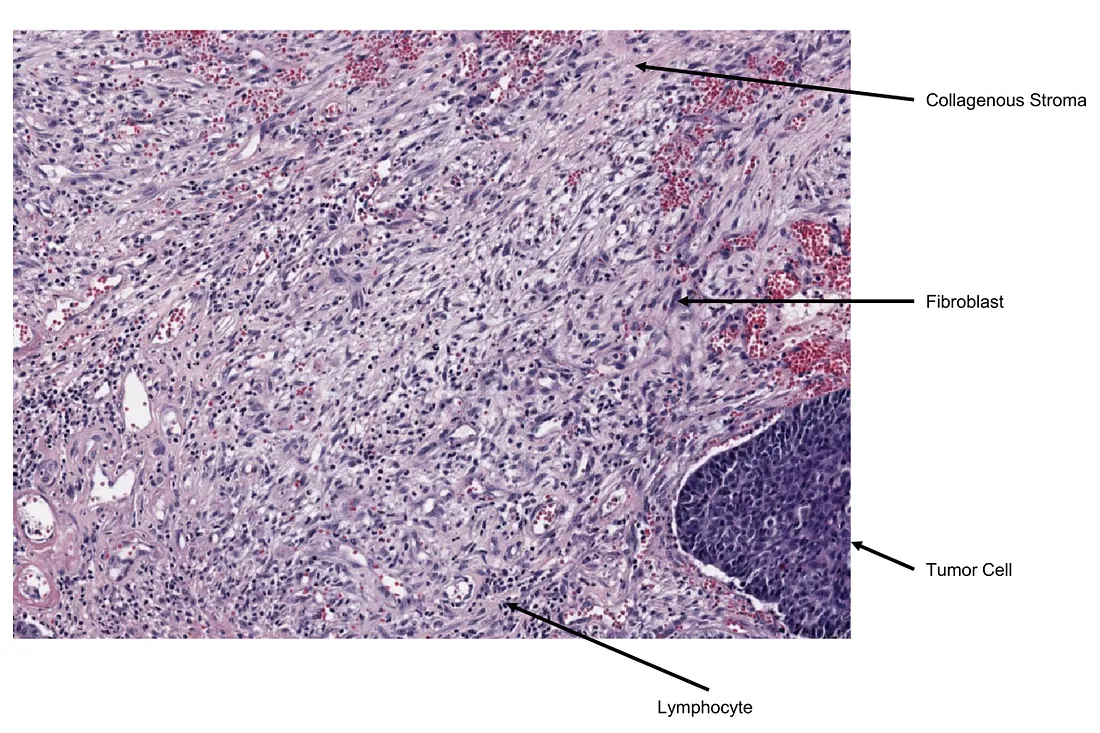 Real-life example of collagenous stroma (created by the author)
TSR is a well-known metric to partially describe the stromal architecture. In the literature, the way to calculate TSR is a bit confusing. Generally, TSR is calculated by the stromal area divided by the whole tumor area, under the subjective eyes of a pathologist. TSR is evaluated in the most stroma-high region in the tumor with tumor cells surrounding the visual field of the microscope [3]. The simple AI solution to this task is semantic segmentation, where at least 2 classes of tumor and stroma are defined.
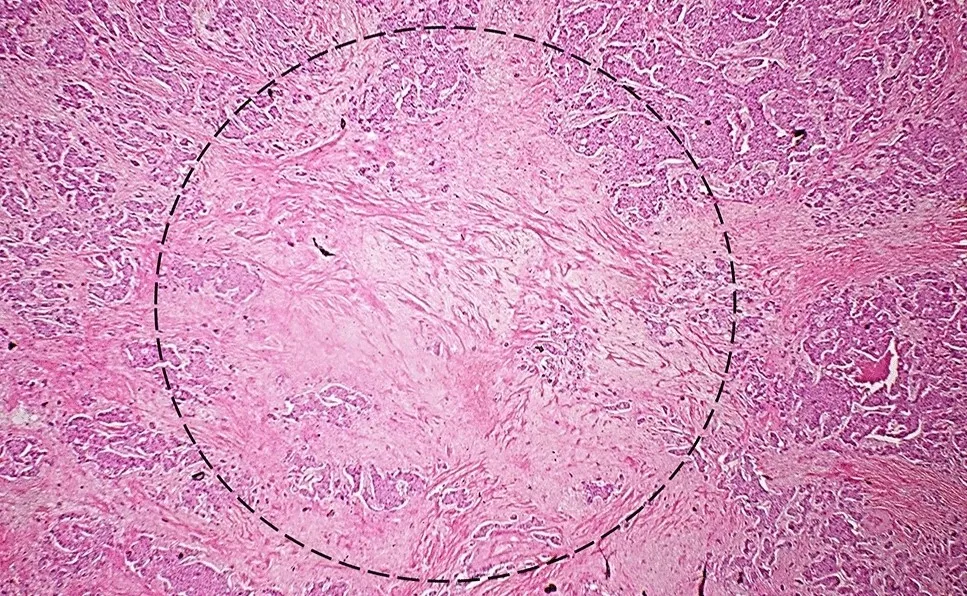 The illustration of a visual field to evaluate TSR (created in [3] by the author)
Tumor Microenvironment — PathAI
There is an ambitious study of PathAI company attempting to use larger CV models to extract all features of TME that human pathologists can understand (not black-box features) [4]. They trained 2 segmentation models (tissue-type and cell-type) in 2 different magnifications of histopathology slides, after which they used the resulting semantic masks to calculate HIFs by combining each cell-type class with each tissue-type class, cell-cell interaction, proportion, density, etc.
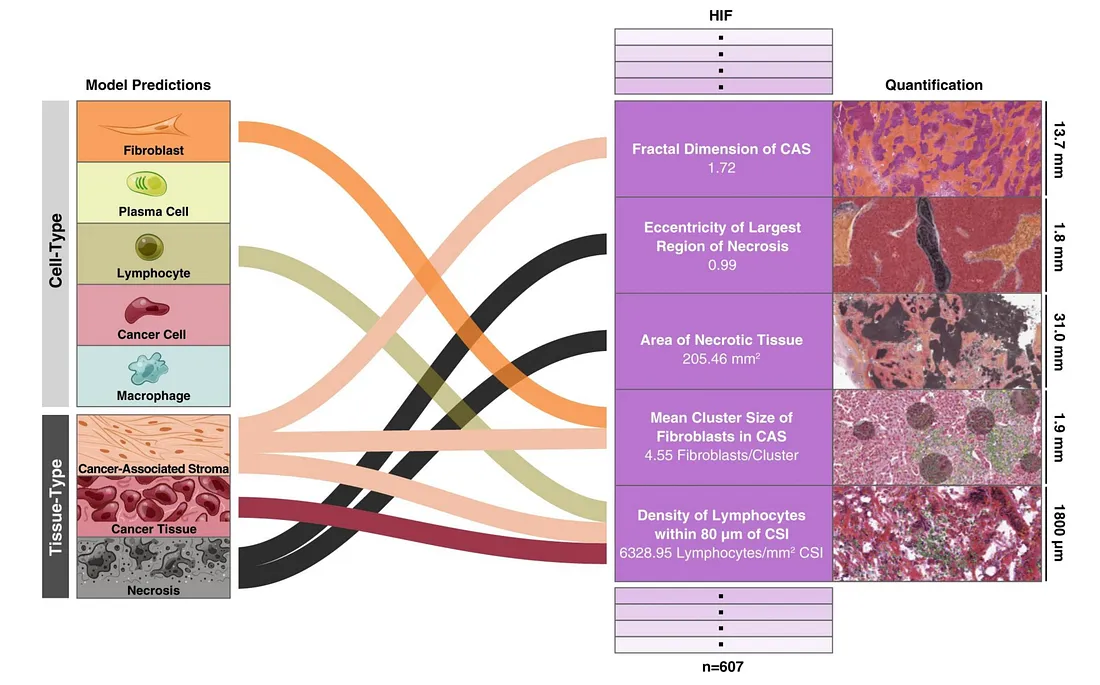 Examples of HIF. Images from [4]
Their approach to using a framework of CV models to calibrate HIF is interesting although the performance was not always good in every task. There can be a number of reasons for the poor performance to happen. Perhaps the best way to improve the model is to further sophisticate the training pipeline while taking outcome variables (e.g., recurrence or drug response) into account.
Conclusion
Extracting biomarkers from histopathology slides is a potential and interesting approach, which addresses the model agnostic issue. While interpretable models are preferred for their transparency, they may not always be as accurate as non-interpretable ones [6].
Therefore, the choice between interpretable and non-interpretable models in digital pathology research ultimately lies with the researcher. This decision is primarily driven by the specific objectives of their computer vision (CV) models.
To those who may be interested, I hope you enjoy this mini-review.
References
- Ding, Ruiwen, et al. “Improving Mitosis Detection on Histopathology Images Using Large Vision-Language Models.” Export.arxiv.org, 11 Oct. 2023, export.arxiv.org/abs/2310.07176. Accessed 16 Nov. 2023.
- Salgado R, Denkert C, Demaria S, Sirtaine N, Klauschen F, Pruneri G, Wienert S, Van den Eynden G, Baehner FL, Penault-Llorca F, Perez EA, Thompson EA, Symmans WF, Richardson AL, Brock J, Criscitiello C, Bailey H, Ignatiadis M, Floris G, Sparano J, Kos Z, Nielsen T, Rimm DL, Allison KH, Reis-Filho JS, Loibl S, Sotiriou C, Viale G, Badve S, Adams S, Willard-Gallo K, Loi S; International TILs Working Group 2014. The evaluation of tumor-infiltrating lymphocytes (TILs) in breast cancer: recommendations by an International TILs Working Group 2014. Ann Oncol. 2015 Feb;26(2):259–71. doi: 10.1093/annonc/mdu450. Epub 2014 Sep 11. PMID: 25214542; PMCID: PMC6267863.
- Le MK, Odate T, Kawai M, Oishi N, Kondo T. Investigating the role of core needle biopsy in evaluating tumor-stroma ratio (TSR) of invasive breast cancer: a retrospective study. Breast Cancer Res Treat. 2023 Jan;197(1):113–121. doi: 10.1007/s10549–022–06768–0. Epub 2022 Nov 6. PMID: 36335529.
- Diao JA, Wang JK, Chui WF, Mountain V, Gullapally SC, Srinivasan R, Mitchell RN, Glass B, Hoffman S, Rao SK, Maheshwari C, Lahiri A, Prakash A, McLoughlin R, Kerner JK, Resnick MB, Montalto MC, Khosla A, Wapinski IN, Beck AH, Elliott HL, Taylor-Weiner A. Human-interpretable image features derived from densely mapped cancer pathology slides predict diverse molecular phenotypes. Nat Commun. 2021 Mar 12;12(1):1613. doi: 10.1038/s41467–021–21896–9. PMID: 33712588; PMCID: PMC7955068.
- Ribeiro, Marco Tulio, et al. “Model-Agnostic Interpretability of Machine Learning.” ArXiv:1606.05386 [Cs, Stat], 16 June 2016, arxiv.org/abs/1606.05386.